Find your slowest pages
across your entire site
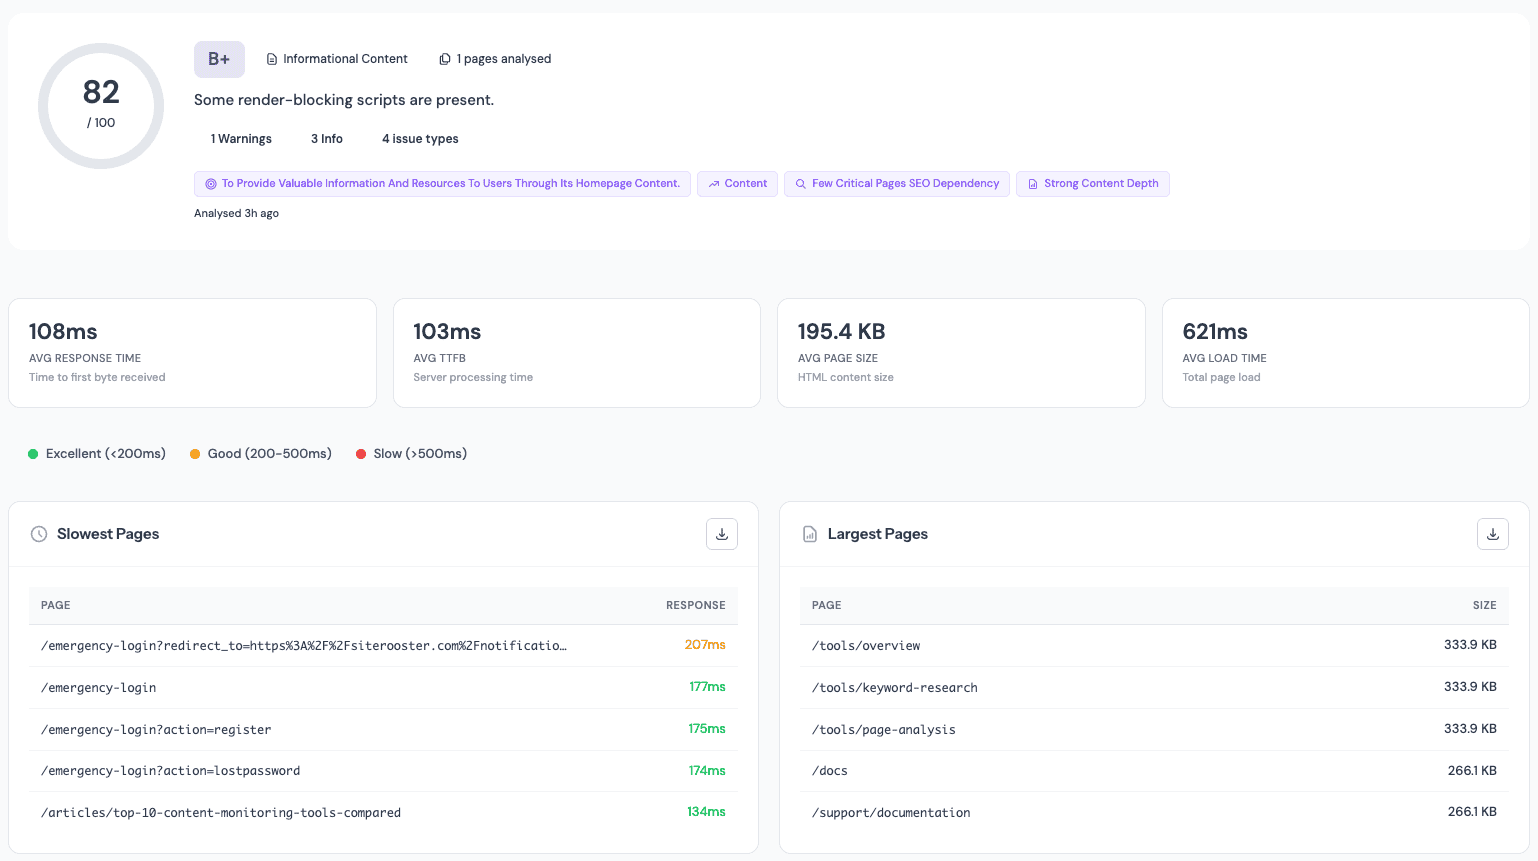
SiteRooster measures performance signals on every crawled page — TTFB, load time, HTML size, render-blocking scripts, and image issues — then aggregates them into a site-wide picture so you know exactly where to focus.
Full performance analysis for $1 · 7-day trial · no auto-renewal
Every page. Every signal.
Ranked by impact.
Performance is one of 8 categories in SiteRooster’s Page Intelligence audit. Every crawled page is assessed across these 8 checks, and findings are triaged by the AI engine by their impact on user experience and rankings.
TTFB
Time to First Byte — how quickly your server responds. Flagged as warning above 800ms, critical above 1.5s.
Load Time
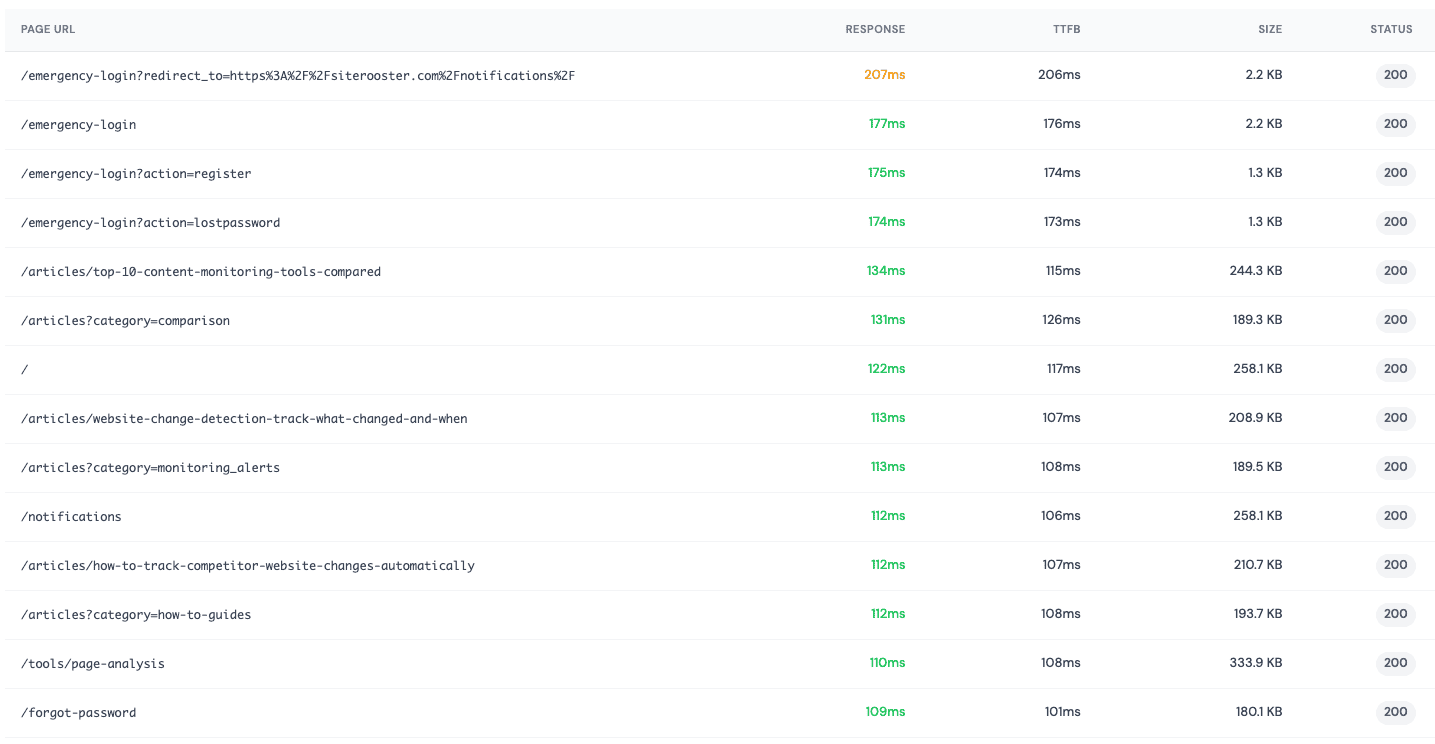
Total page load time measured during crawl. Ranked site-wide so you can see your slowest pages at a glance.
HTML Size
Page HTML weight in KB. Large HTML files slow parsing and hurt Core Web Vitals — flagged above 100KB.
Render-Blocking Scripts
JavaScript loaded synchronously in the head that delays rendering. Flagged when more than 3 are found.
Image Alt Text
Missing alt attributes flagged by ratio and count. Critical for accessibility and image search indexing.
Image Dimensions
Images missing explicit width and height attributes cause layout shift (CLS). Detected and flagged per page.
Image Format
JPEG and PNG images that could be converted to WebP or AVIF for significant size savings — flagged as opportunities.
Resource Hints
Checks for preload, prefetch, and dns-prefetch hints on slow resources. A low-effort optimisation often overlooked.
Not just one page —
your whole site ranked
After crawling, SiteRooster aggregates performance data across all your pages and surfaces the most actionable patterns at the site level.
Slowest Pages
Your pages ranked by load time and TTFB. Immediately see which URLs are dragging your performance average down.
Performance Averages
Average response times, TTFB, HTML sizes, and image ratios across all crawled pages — with trend tracking between crawls.
Issue Count by Check
See how many pages fail each of the 8 performance checks, filterable by critical, warning, or informational severity.
Find what’s slowing
your site down
Enter any URL and get performance data across your entire site. Start your $1 trial for the full audit.
7-day trial · no auto-renewal · view all plans